


Interactive Features
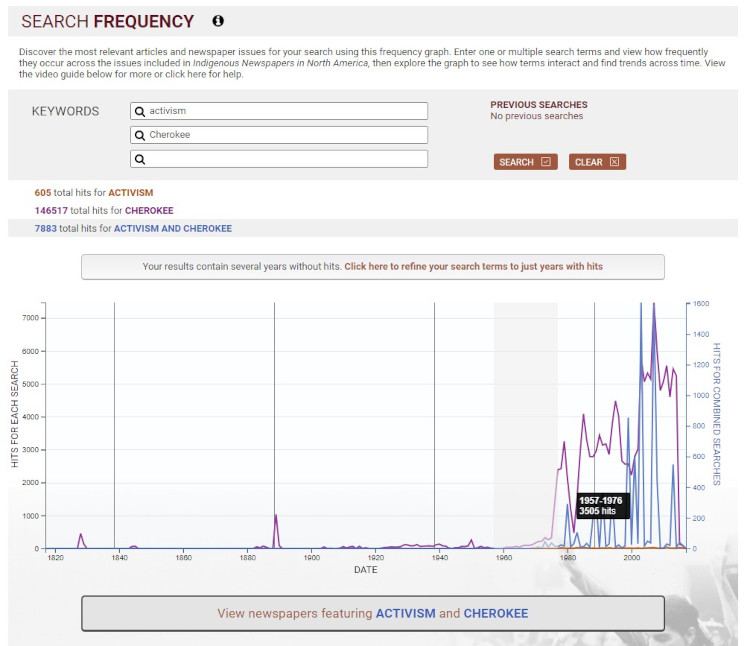
This resource also includes an interactive feature designed to support and enhance your research experience; the Search Frequency graph allows you to find trends over time by displaying the frequency with which one or more search terms appear across every publication in the resource. Hits for search terms are then displayed in the graph with contrasting colours. Using the "Click to refine your search terms..." and "View newspapers featuring..." buttons allows you to refine your search terms to just years with hits or to view your search results in the newspapers respectively. Hovering over the graph allows you to see the number of hits in each 20-year segment. Clicking a segment will reload a graph showing results only across this period.
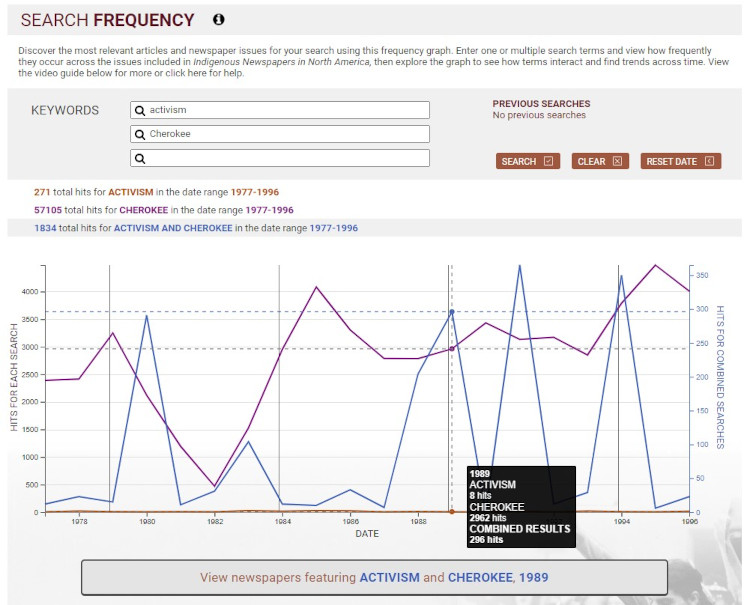
When you have narrowed the graph to a particular segment, you can then hover over the lines on the refined graph to see the number of hits for a single year. By clicking on the graph before clicking on the "View newspapers featuring..." button, you can go to a search result using your chosen search terms containing newspapers from only that year.
Next: Photo Features
Previous: Newspapers